


Content uploaded by Kwangsik Han
Author content
All content in this area was uploaded by Kwangsik Han on Sep 25, 2018
Content may be subject to copyright.
ISIJ International, Vol. 58 (2018), No. 9
© 2018 ISIJ 1578
ISIJ International, Vol. 58 (2018), No. 9, pp. 1578–1583
* Corresponding author: E-mail: k_han@material.tohoku.ac.jp
DOI: http://dx.doi.org/10.2355/isijinternational.ISIJINT-2018-111
1. Introduction
Hot-dip galvanizing (GI) and galvannealing (GA) tech-
niques are known to be very eective in improving the
corrosion resistance of steel sheets for automobile bodies
without change in material characteristics. The GI pro-
cess has been generally performed by the immersion of
steel plates into a molten Zn–Al bath maintained at about
445°C–455°C for several seconds,1) whereby very simple
coating layers,
η
Fe2Al5 (Cmcm) and Zn solid solution,
were mainly observed. Conversely, in the GA process, the
annealing is carried out at about 500°C1)–530°C2) after the
GI process; intermetallic compound (IMC) layers of the
Fe-rich portion in the Zn–Fe binary system are formed by
a long reaction time between the Fe substrate and
ζ
-FeZn13
(P63/mmc) layer.1,3–5) The processes are carefully controlled
to suppress defects such as aking and powdering that occur
in press forming.
Recently, the phase diagram of the Zn–Fe binary system
was experimentally determined by an alloying method,6)
and phase equilibria of ve IMCs, Γ-Fe4Zn9 (I
4
3m),
Γ1-Fe21.2Zn80.8 (F
4
3m),
δ
1k-FeZn7 (P63/mcm and R3c),
δ
1p-Fe13Zn126 (P63/mmc) and
ζ
were precisely conrmed as
shown in Fig. 1. The aking and the powdering are believed
to be directly related to formation of the Γ phase layer in the
diusion zone, because the fractures in the plating layer dur-
ing the deformation process are frequently observed on the
α
Fe/Γ phase boundary or in the Γ phase layer.1,7) Therefore,
mechanical properties of the IMCs (especially, Γ phase) are
a key issue to be examined for improving the formability of
Micro-Vickers Hardness of Intermetallic Compounds in the Zn-rich
Portion of Zn–Fe Binary System
Kwangsik HAN,1)* Inho LEE,1) Ikuo OHNUMA,2) Kaneharu OKUDA3) and Ryosuke KAINUMA1)
1) Department of Materials Science, Tohoku University, 6-6-02 Aobayama, Sendai, 980-8579 Japan.
2) Computational Materials Science Unit, National Institute for Materials Science (NIMS), 1-2-1 Sengen, Tsukuba, 305-0047
Japan. 3) Steel Research Laboratory, JFE Steel Corporation, Kawasaki, Japan.
(Received on February 19, 2018; accepted on March 20, 2018)
Annealing temperature and composition dependences of hardness for the intermetallic compound
phases, especially Γ-Fe4Zn9,
δ
1p-Fe13Zn126 and
δ
1k-FeZn7, which are obtained in Zn-rich portion of Fe–Zn
alloys, were investigated by the micro-Vickers hardness test. Although the hardness of the Γ and
δ
1k
phases only slightly decreases with increasing quenching temperature, it shows obvious composition
dependences. However, the hardness of the disordered
δ
1p phase is basically lower than that of the
ordered
δ
1k phase, which is hardly affected by composition change. The hardness of all the Zn-rich com-
pound phases quenched from 500°C (or 550°C) are evaluated and compared.
KEY WORDS: hot-dip galvanizing; vickers hardness; intermetallic compounds; annealing temperature and
composition dependences.
Zn-coated steel sheets.
The deformability of each IMC in the Fe–Zn system was
recently evaluated by Okamoto et al.7) by using a compres-
sion test of micropillars. According to them, the Γ phase has
enough ductility both in poly- and single-crystalline struc-
tures, satisfying von Mises criterion. Moreover, although the
ζ
phase is also ductile and shows a large plastic strain only
in single-crystal, the other three phases are basically brittle
in both poly- and single-crystal.
However, Vickers hardness test is also one of the most
important methods for most easily evaluating the mechani-
cal property of materials. Hardness of Γ, Γ1,
δ
and
ζ
have
already been reported by Bastin et al.,8) where the micro-
Vickers hardness test was performed for each IMC layer
Fig. 1. Phase diagram of the Zn–Fe binary system.6)
ISIJ International, Vol. 58 (2018), No. 9
© 2018 ISIJ1579
in a diusion couple (DC) specimen. According to them,
among the four IMCs, the highest and lowest hardness val-
ues were obtained in the Γ1 and
ζ
phases, respectively, and
the hardness of the
δ
phase is slightly higher than that of
the Γ phase. To precisely clarify the powdering mechanism,
the chemical-composition dependence of hardness may have
to be considered, especially in stoichiometric composition
(SC) and its compositional deviation. However, they have
reported no information on the composition dependence.
Recently, Kainuma et al.9) reported that while the second
order order-disorder transition from the disordered
δ
1p to the
ordered
δ
1k phase10,11) exists at temperatures above 550°C,
the ordering reaction changes to the rst order transition and
a phase separation (i.e.,
δ
1k +
δ
1p two-phase region) appears
at temperatures below 550°C. Very recently, the miscibil-
ity gap with a narrow two-phase region of only 0.5 at.%
has been conrmed by the present authors with two-phase
microstructure obtained by the alloying method.6) Further-
more, it has also been reported that the hardness of the
δ
1k
phase is much higher than that of the
δ
1p one and that the
dierence in hardness is available for identifying the struc-
ture.6) Eects of the chemical composition and the degree
of order on hardness of the ordered-
δ
1k phase are important
and interesting, but no systematic investigation on the issue
has yet been reported.
In the present study, dependence of hardness on anneal-
ing temperatures and compositions were examined by the
micro-Vickers hardness test. Especially, composition depen-
dences for Γ, ordered-
δ
1k and disordered-
δ
1p were precisely
investigated.
2. Experimental Procedures
The Fe–Zn alloys were prepared by high purity Fe (99.9
at.%) and Zn (99.99 at.%). Samples were melted by two-
step melting (TSM) and re-melting (RM) methods according
to the same procedure that was used in a previous study.6)
Prepared samples were equilibrated at temperature ranges
between 300°C and 700°C for various annealing times.
After equilibration, the hardness of each phase was very
carefully measured by a Micro-Vickers hardness tester
(Akashi, MVK-H1) under an applied load of 10 g (Fload =
0.01 × 9.8 N) for 10 seconds in two-phase microstructures.
To remove the inuence on the working hardening, the dis-
tance of each diamond indentation was located suciently
far from the previously measured location, as shown in Fig.
2. Sizes of indentations and horizontal (D1) and vertical (D2)
lengths were measured by observation of the eld-emission
scanning electron microscope (FE-SEM) at high magnica-
tion. The hardness was calculated by the following standard
formula:
HV F
DD
load
1 8544 0 102
2
12
2
..
/
,
where the units of Fload and Di are N and mm. The chemi-
cal compositions in the vicinity of the diamond indentation
were measured by wavelength dispersive X-ray spectros-
copy (WDS) equipped with a eld-emission electron probe
microanalyzer (FE-EPMA: JEOL JXA-8500F) under the
condition of an accelerating voltage of 20 kV and a beam
current of 10 nA. Transmission electron microscope (TEM)
samples were prepared by focused ion beam (FIB), and
selected area electron diraction (SAED) patterns were
observed by a scanning transmission electron microscope
(STEM: JEOL JEM ARM-200F) under the condition of an
accelerating voltage of 200 kV. The stable phases obtained
in the present study were plotted on the phase diagram as
shown in Fig. 3, and annealing temperatures, hardness and
chemical compositions are summarized in Table 1.
3. Results and Discussion
3.1. Microstructure Near Indentation and Hardness in
IMCs
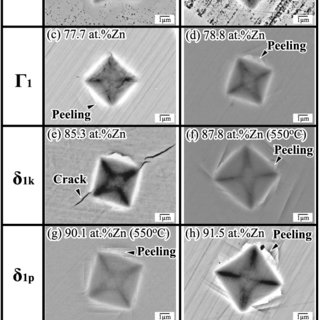
Figure 4 shows the typical microstructure of diamond
indentation for every IMC phase in the
α
Fe +Γ, Γ+Γ
1,
Γ1+
δ
1k,
δ
1k +
δ
1p,
δ
1p +
ζ
and
ζ
+L(
η
) two-phase alloys
obtained by annealing at 500°C, where a pair of indenta-
tions, i.e., on the Zn-rich and Fe-rich sides, is presented
for each IMC. Note that those for the Zn-rich
δ
1k and the
Fe-rich
δ
1p were obtained from samples after heat treatment
at 550°C, because two-phases microstructures obtained at
Fig. 2. Typical BSE image of the diamond indentation for the Γ
and
δ
1k two phases after heat treatment at 600°C.
Fig. 3. The equilibrium compositions of samples for measurement
of hardness.
ISIJ International, Vol. 58 (2018), No. 9
© 2018 ISIJ 1580
500°C were too ne to be quantitatively evaluated even in
a hardness test with the lightest load. The peelings were
mostly observed in Γ1,
δ
1k,
δ
1p and
ζ
phases; the hairline
cracks mainly occurred in Fe-enriched
δ
1k, whereas no
defects were observed in Γ. In general, surface peelings or
hairline cracks are usually observed in brittle phases. Thus,
the microstructures in the diamond indentation suggest that
although most IMCs, especially in the
δ
1k phase on the Fe-
rich side, are very brittle, the Γ phase possesses a relatively
high ductility. A similar tendency has been reported by
Okamoto et al.7) using the micro-pillar compression test.
The hardness values of all the IMCs evaluated from the
indentations in Fig. 4 are shown in Fig. 5. The hardness val-
ues of the IMCs are observed to basically follow the order
of Γ1 >
δ
1k > Γ ≈
δ
1p >
ζ
, which is the same tendency as
that of our previous report obtained from 450°C,12) whereas
the composition dependence is signicant in the Γ and the
δ
1k. The data reported by Bastin et al.8) from DC samples
heat treated at 450°C are also plotted in Fig. 5. While the
hardness data in the present study are slightly higher than
those on the whole, the tendency of the order in hardness
is almost consistent. The dierence in hardness from the
previous data may be due to the dierence of the loading
weight in the hardness test.13)
In the past, the GA process has been performed to
increase the Fe concentration in coating layers due to
decreasing friction coecient by formation of harder IMC
layers. Furthermore, the control of volume fraction of the
IMC layers with various Fe concentrations is one of the
most important issues to improve the press-formability.
The powdering in the GA process is known to mostly occur
when the Fe concentration in the coating layers is too high,
which may be consistent with the brittleness and the high
hardness obtained in the
δ
1k phase on the Fe-rich side. This
suggests that, to inhibit the powdering defect, the control
of Fe concentration in the
δ
1k is important. In the following
sections, the annealing temperature and chemical composi-
tion dependencies of hardness for the Γ,
δ
1k and
δ
1p phases
are presented.
3.2. Annealing Temperature Dependence of Hardness
for Γ,
δ
1k and
δ
1p
As shown in the phase diagram of Fig. 3, the phase exist-
ing in a wide temperature range is limited to the Γ and
δ
,
Fig. 4. Typical microstr uctures defor med by diamond indenta-
tion. (a, b) Γ-Fe4Zn9 (c, d) Γ1-Fe21.2Zn80.8 (e, f)
δ
1k-FeZn7 (g,
h)
δ
1p-Fe13Zn123 (i, j)
ζ
-FeZn13.
Tab le 1. Sum mary of annealing temperat ures, hardness and equi-
libria composition s.
Phase Te m p e r at u r e
(℃)
Hardness
(HV)
Equilibrium
composition
(at .%Zn)
Fe-enr iched Γ (■)
300 393 ( ±13) 69.5 ( ±0. 3)
400 408 ( ±10) 69.1 ( ±0.2)
500 386 ( ±11) 68.5 (±0. 3)
600 387 ( ±17 ) 68.2 ( ±0. 3)
700 383 ( ±12) 68.4 ( ±0.2)
Zn-en riched Γ (□)
500 440 ( ±10) 74.1 ( ± 0.1)
600 458 ( ±10) 75.7 ( ±0. 2)
650 475 ( ±14) 77.2 ( ±0.1)
675 481 ( ±13) 7 7.5 ( ±0.2)
700 460 ( ±6) 75.8 ( ±0. 2)
730 433 ( ±10) 73.5 ( ±0.2)
Fe-enr iched Γ1 (▲)500 587 ( ±9) 77.7 ( ±0.2)
Zn-en riched Γ1 (△)500 560 ( ±15) 78.8 (± 0.1)
Fe-enr iched
δ
1k (●)
500 525 ( ±12) 85.3 ( ±0.1)
600 505 ( ±6) 85.1 ( ±0.1)
650 502 ( ±14) 85.6 ( ±0. 2)
Zn-en riched
δ
1k (○)
400 392 ( ±7) 90.8 (±0.0)
550 433 ( ±14) 87.8 ( ±0.1)
580 430 ( ±13) 89.3 ( ±0.1)
615 448 ( ±8) 86.5 ( ±0.1)
δ
1p (◆)
500 379 ( ±10) 91.5 ( ±0.1)
550 394 ( ±8) 90.1 ( ±0.1)
580 374 ( ±11) 90.3 ( ±0.1)
Fe-enr iched
ζ
(▼)
400 298 ( ±7) 92.2 ( ±0.1)
500 280 ( ±16) 92.2 ( ±0. 2)
Zn-en riched
ζ
(▽)500 291 ( ±10) 92.5 (±0.1)
ISIJ International, Vol. 58 (2018), No. 9
© 2018 ISIJ1581
and the dependence of annealing temperatures was evalu-
ated for the Γ,
δ
1k and
δ
1p, where the groups of hardness
data with similar composition were selected for each IMC.
Figure 6 shows the variation of hardness on the annealing
temperatures for the Γ,
δ
1k and
δ
1p phases with 68.8 ± 0.5,
85.4 ± 0.3 and 90.6 ± 0.6 at.% Zn, respectively. The hard-
ness is basically hardly aected by the annealing tempera-
ture, but all the IMCs actually decrease very faintly with
increasing annealing temperature. Generally, the Vickers
hardness depends on the amount of dislocations gener-
ated by mechanical deformations, and the atomic bonding
strength. Therefore, if neither phase transformation nor
change of degree of atomic order exists in the temperature
region, hardness at room temperature may be almost con-
stant, regardless of the annealing temperature. The reason
why the hardness for the IMCs slightly decreases at higher
temperatures is unclear.
3.3. Composition Dependence of Hardness for
Γ-Fe3Zn10,
δ
1k-FeZn7 and
δ
1p-Fe13Zn126
In Section 3.2, it was concluded that the hardness of
all the Γ,
δ
1k and
δ
1p phases are almost independent of
the annealing temperature. Therefore, we assume that the
tendency basically meets that of other alloy compositions
for each IMC, and estimate the composition dependence of
hardness by using the data obtained from the IMC phase
annealed even at dierent temperatures.
3.3.1. Hardness in the Γ Phase
Figure 7 shows hardness of composition dependence in
the Γ phase, together with the SC reported by Brandon et
al.,14) Johannson et al.15) and Okamoto et al.16) Compared
with the hardness in the alloys annealed at dierent tem-
peratures, it is conrmed that while the hardness of Γ hardly
depends on annealing temperature also in the Zn-rich por-
tion, it gradually increases with increasing Zn composition.
The relationship between composition and hardness is well
known and has been discussed in several papers.17–19) For
instance, minimum hardness might be indicated in SC due to
the smallest lattice defects such as vacancies, anti-site atoms
Fig. 5. Hardness of IMCs after heat treatment at 500°C (and 550°C) for Fe-en riched and Zn-enriched IMCs, together
with those at 450°C repor ted by Bastin et al.8)
and stacking faults and the hardness is gradually increased
with the compositional deviation from the SC. If this meets
the present case, the result shown in Fig. 7 means that the
SC of the Γ phase is not Fe3Zn10 of about 77.0 at.%Zn, at
least less than 69.5 at.%Zn.
The SC of Γ-Fe3Zn10 was reported to be 76.9 at.%Zn
(
γ
-brass structure) by Brandon et al.,12) and accepted by
Fi g. 7. Composition dependence of hardness for Γ-Fe4Zn9.
Fig. 6. Annealing temperat ure dependence of hardness for Fe-
enriched Γ-Fe4Zn9,
δ
1k-FeZn7 and
δ
1p-Fe13Zn126.
ISIJ International, Vol. 58 (2018), No. 9
© 2018 ISIJ 1582
Burton and Perrot.20) However, the stoichiometric ratio (SR)
of Γ-Fe3Zn10, NFe : NZn = 3 : 10, seems doubtful, because
the SC was determined by the results based on the XRD
examination, by which it is dicult to determine the exact
occupation sites of each atom in sub-lattices due to the
similar atomic scattering factors of Fe and Zn. Conversely,
several
γ
-brass type phases such as X3Y10, X4Y9 and X5Y8
are reported to form from the BCC or B2 closed structures
by a 26-atom cluster or two dierent 26-atom clusters.16,21,22)
The cluster has four types of sub-lattices, and the SC can be
varied by the element’s occupation. According to Gourdon
et al.,21) the sub-lattice of the Cu5Zn8 phase consists of an
outer-tetrahedron (OT: 4 atoms), an octahedron (OH: 6),
an inner-tetrahedron (IT: 4) and a distorted cuboctahedron
(CO: 12). The mainly occupied element is the Cu atom
in OT and OH, and the Zn atom in IT and CO. In these
sub-lattices, if the Cu site in the OH sub-lattice is partially
substituted by excess Zn atoms, the SC can be shifted from
Cu5Zn8 (61.5 at.%Zn) to Cu4Zn9 (69.2 at.%Zn). However,
very recently, Okamoto et al.16) re-examined the occupation
of Fe and Zn atoms in four sub-lattices and proposed an
atomic conguration model, which is based on the Fe+12Zn
icosahedron cluster structure. According to them, the Fe
atoms are occupied both in OT and IT sub-lattices, whereas
the OH and CO sub-lattices are fully occupied by the Zn
atom, as shown in Fig. 8, which is dierent from those of
Cu and Zn in the Cu5Zn8 phase. If all atoms fully occupy
each corresponding site, the SR of the Γ phase becomes
Fe4Zn9. The composition dependence of hardness in the
present study is consistent with that for SC with Fe4Zn9 of
69.2 at.%Zn, which was reported by Johannson et al.15) and
Okamoto et al.16)
3.3.2. Hardness in Ordered-
δ
1k and Disordered-
δ
1p Phases
The composition dependences of hardness on both
ordered-
δ
1k and disordered-
δ
1p phases are shown in Fig. 9,
together with the data in our previous paper.6) Owing to the
relationship between SC and hardness mentioned in Section
3.3.1, both hardness of the SC
δ
1k-FeZn7 at 87.5 at.%Zn
and
δ
1p-Fe13Zn126 at 90.6 at.%Zn were also expected to be
minimum and to indicate a “V shape” around the SC. In the
δ
1p, the hardness is observed to be almost constant at about
390 Hv against composition change, where the disordered
structure of the sample was conrmed from the SAED pat-
tern of [0001] incident direction taken from the 89.3 at.%Zn
sample annealed at 615°C, as shown in Fig. 10(b). If the
δ
1p phase obeys the general rule in hardness of IMCs, the
hardness has to increase with increasing Fe composition.
Fig. 8. Schematic illustration of the
γ
-brass cluster.16,21,22)
Fig. 9. Hardness distribution of ordered-
δ
1k and disordered-
δ
1p in
accordance with Zn concentration.
ISIJ International, Vol. 58 (2018), No. 9
© 2018 ISIJ1583
The constant hardness in the wide o-stoichiometric com-
position range may be brought about by the yielding stress
invariable for substitution of Fe atoms to some Zn sites.
The origin is not clear. Further studies on the substitutional
atomic sites of excess Fe atoms and the slip systems are
required. By contrast, the composition dependence in the
δ
1k is very complicated, i.e., the hardness almost linearly
decreases with increasing Zn composition to the SC com-
position of FeZn7 (87.5 at.%Zn), but from the SC composi-
tion suddenly changes to be almost constant and then drops
again to the level of hardness in the
δ
1p phase at about
90.4 at.%Zn. Here, the ordered conguration of the
δ
1k in
the 89.3 at.%Zn sample annealed at 580°C has been con-
rmed from the SAED pattern with the ordered spots of 1/3
{11
2
0}
δ
1p, as shown in Fig. 10(a). Thus, clearly, the hard-
ness of the ordered
δ
1k is higher than that of the disordered
δ
1p, as reported in our previous paper.6) Because the
δ
1p →
δ
1k order-disorder transformation temperature drastically
decreases with increasing Zn composition, as shown in Fig.
9, the complicated behavior in the composition region over
the SC composition (FeZn7) in the
δ
1k may be explained by
the decrease of the degree of order. Consequently, the
δ
1k
at 90.4 at.%Zn should have a very low degree of order and
the hardness may be close to that of the
δ
1p.
All these results suggest that when controlling the micro-
structure in the coating layer including the
δ
phase, one
should take into account not only the kind of ordered or dis-
ordered phase, but also the Fe composition, in the
δ
phase.
4. Conclusions
The microstructures of indention and the hardness in the
IMCs appearing in Zn-rich portion of the Zn–Fe binary sys-
tem were examined by micro-Vickers hardness test.
(1) From the microstructures of indention, the peelings
were mostly observed in the Γ1,
δ
1k,
δ
1p and
ζ
phases and
the hairline cracks mainly occurred in the Fe-enriched
δ
1k,
whereas no defects were observed in Γ.
(2) The hardness values of the IMCs are basically in
order of Γ1 >
δ
1k > Γ ≈
δ
1p >
ζ
.
(3) The hardness of the Γ,
δ
1k and
δ
1p phases were
almost independent of the annealing temperatures.
(4) In the Γ phase, the hardness gradually increases
with increasing Zn composition from 67.6 at.%Zn to 77.5
at.%Zn. This suggests that the SC of the Γ may not be at
Fe3Zn10.
(5) The hardness of
δ
1p is almost constant against the
Zn composition. However, the hardness of
δ
1k decreases
with increasing Zn composition and reaches an almost
similar level to that in disordered-
δ
1p on the Zn-rich side.
This means that the hardness of
δ
1k is strongly aected by
degree of order.
Acknowledgments
The authors would like to thank Prof. N. L. Okamoto at
Institute for Materials Research (IMR) of Tohoku university
for very meaningful discussion. This work was supported
by JSPS KAKENHI Grant Numbers 15H05766 and by The
Iron and Steel Institute of Japan.
REFERENCES
1) A. R. Marder: Prog. Mater. Sci., 45 (2000), 191.
2) J. Mackowial and N. R. Short: Int. Met. Rev., 24 (1979), 1.
3) C. E. Jordan and A. R. Marder: J. Mater. Sci., 32 (1997), 5593.
4) R. Kainuma and K. Ishida: ISIJ Int., 47 (2007), 740.
5) M. Safaeirad, M. R. Toroghinejad and F. Ashrazadeh: J. Mater.
Process. Technol., 196 (2008), 205.
6) K. Han, I. Ohnuma, K. Okuda and R. Kainuma: J. Alloy. Compd.,
737 (2018), 490.
7) N. L. Okamoto, D. Kashioka, M. Inomoto, H. Inui, H. Takebayashi
and S. Yamaguchi: Scr. Mater., 69 (2013), 307.
8) G. F. Bastin, F. J. J. van Loo and G. D. Rieck: Z. Metallkd., 65
(1974), 656.
9) R. Kainuma and K. Ishida: Tetsu-to-Hagané, 91 (2005), 349.
10) M. H. Hong and H. Saka: Scr. Mater., 36 (1997), 1423.
11) N. L. Okamoto, K. Tanaka, A. Yasuhara and H. Inui: Acta Crystal-
logr. B, 70 (2014), 275.
12) K. Han, I. Ohnuma, K. Okuda and R. Kainuma: Proc. 11th Int. Conf.
on Zinc and Zinc Alloy Coated Steel Sheet, (Galvatech 2017), ISIJ,
Tokyo, (2017), 83.
13) W. D. Nix and H. Gao: J. Mech. Phys. Solids, 46 (1998), 411.
14) J. K. Brandon, R. Y. Brizard, P. C. Chieh, R. K. Mcmillan and W.
B. Pearson: Acta Crystallogr. B, 30 (1974), 1412.
15) A. Johannsson, H. Ljung and S. Westman: Acta Chem. Scand., 22
(1968), 2743.
16) N. L. Okamoto, M. Inomoto, H. Takebayashi and H. Inui: J. Alloy.
Compd., 732 (2018), 52.
17) J. H. Westbrook: J. Electrochem. Soc., 103 (1956), 54.
18) L. M. Pike, Y. A. Chang and C. T. Liu: Acta Mater., 45 (1997), 3709.
19) J. H. Zhu, L. M. Pike, C. T. Liu and P. K. Liaw: Acta Mater., 47
(1999), 2003.
20) B. P. Burton and P. Perrot: Phase Diagram of Binary Iron Alloys, ed.
by H. Okamoto, ASM International, Material Park, OH, (1993), 459.
21) O. Gourdon, D. Gout, D. J. Williams, T. Proen, S. Hobbs and G. J.
Miller: Inorg. Chem., 46 (2007), 251.
22) T. B. Massalski: Mater. Trans., 51 (2010), 583.
Fig. 10. Typical SAED patterns obtained from [0001] direction of
(a) ordered-
δ
1k and (b) disordered-
δ
1p. Each of the phases
were obtained from the annealed samples of A and B in
Fig . 9.


